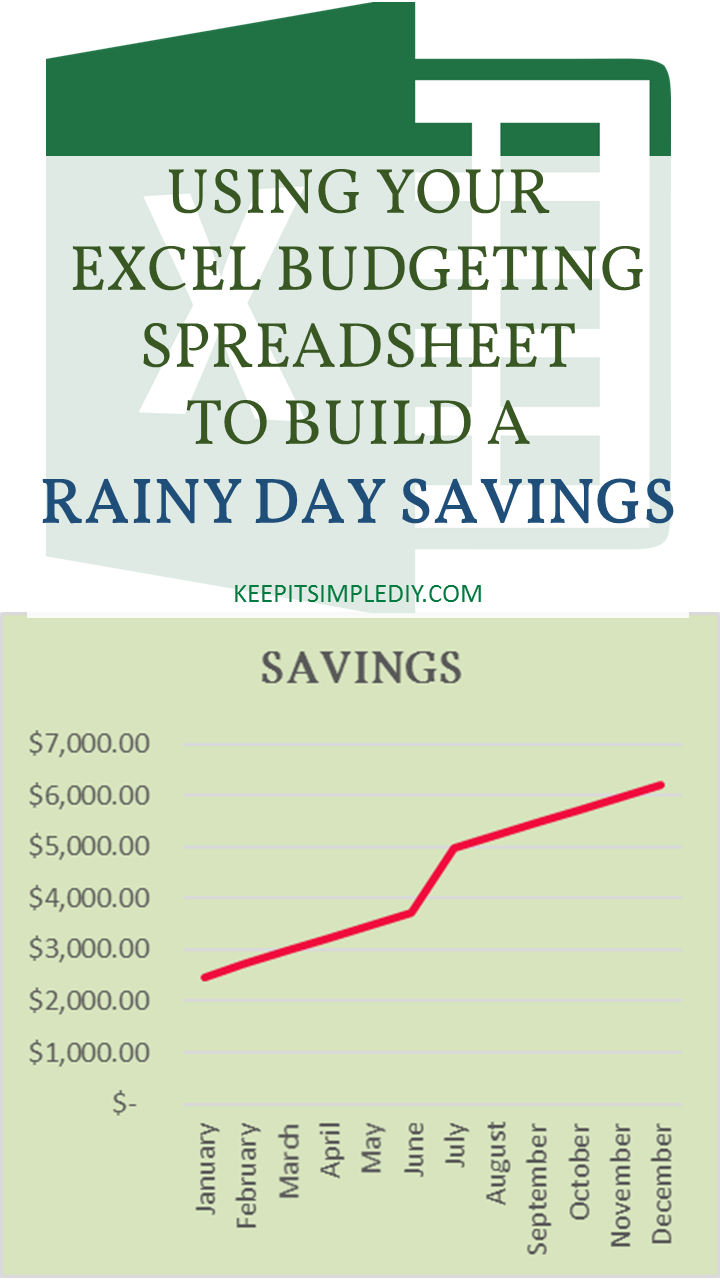
Now that we have our savings account created and have determined our saving schedule, we can use our spreadsheet to predict how long it will take to build a Rainy Day Savings.
It is good practice to always have six months worth of expenses in your savings account just in case something unexpected happens. We could also include the money in the checking account, but I would always prefer to air on the side of caution because my motto is ‘better safe than sorry’. Because of this, I will only include the savings account total.
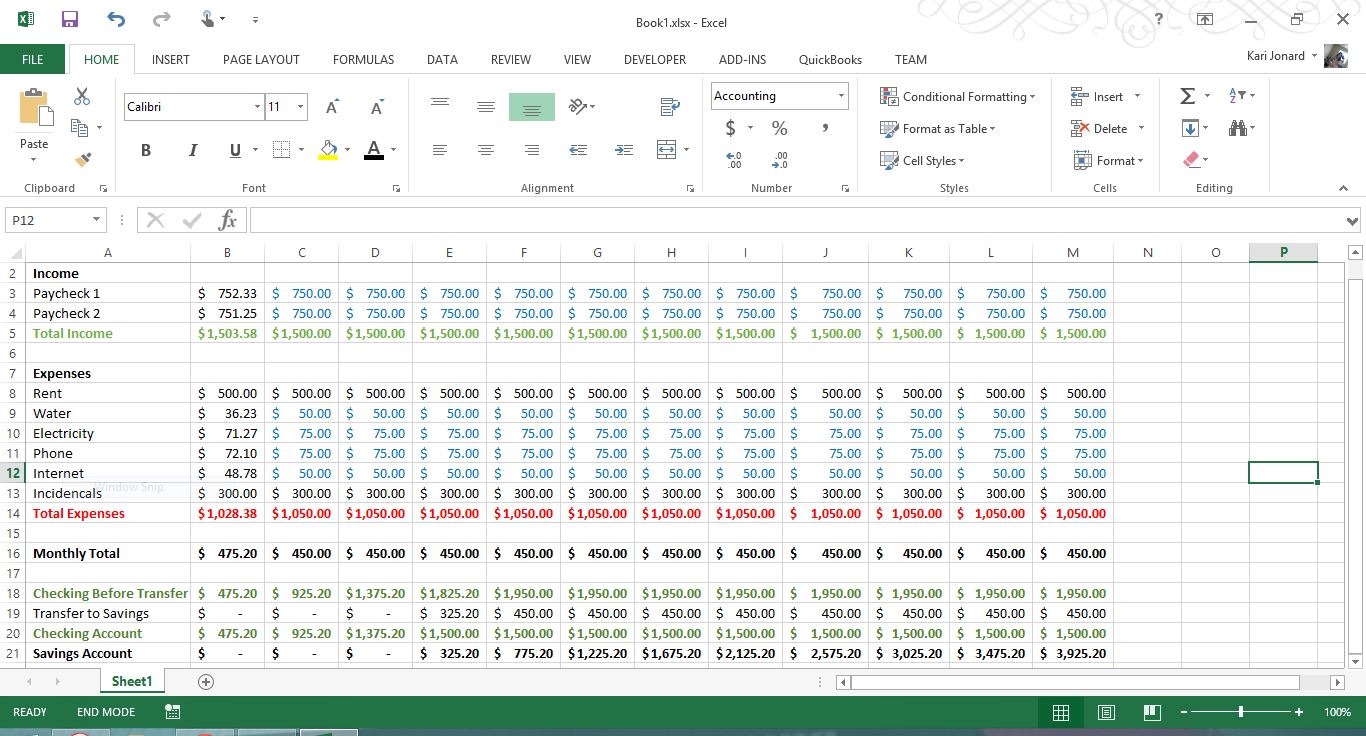
In our example, we know that the monthly expenses are roughly $1050. Six months of expenses would be $6300. By looking at the savings account total in column M: December, we see that the total amount in the savings account is $3900. This is not enough to last six months.
To project further, we will need to add another year to our example.
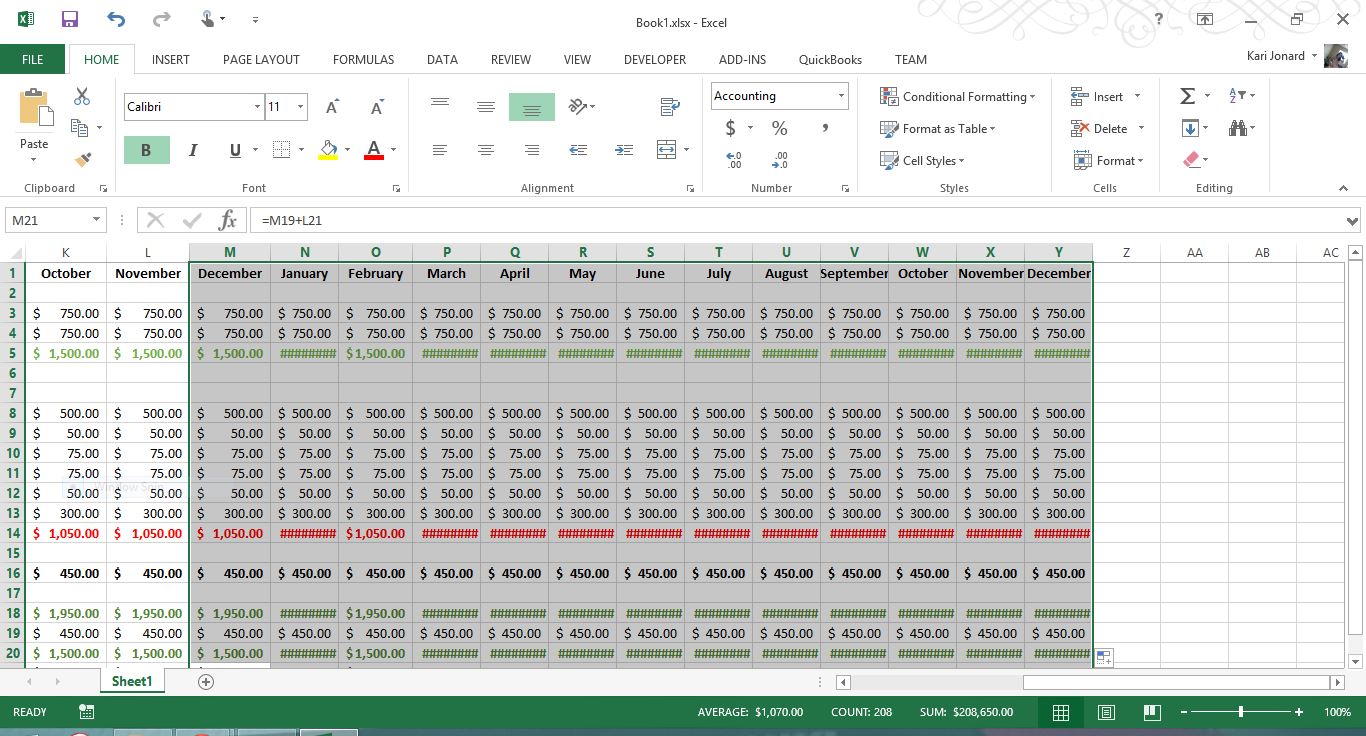
Using the techniques from before, we will highlight all of the the December column (M1:M21) and drag across to column Y. Highlight all cells in the sheet by pressing the Triangle in the top left corner then double click on line between the column headers to widen the fields and remove the pound signs. *If you have trouble with this step, please refer to the first tutorial’s video.
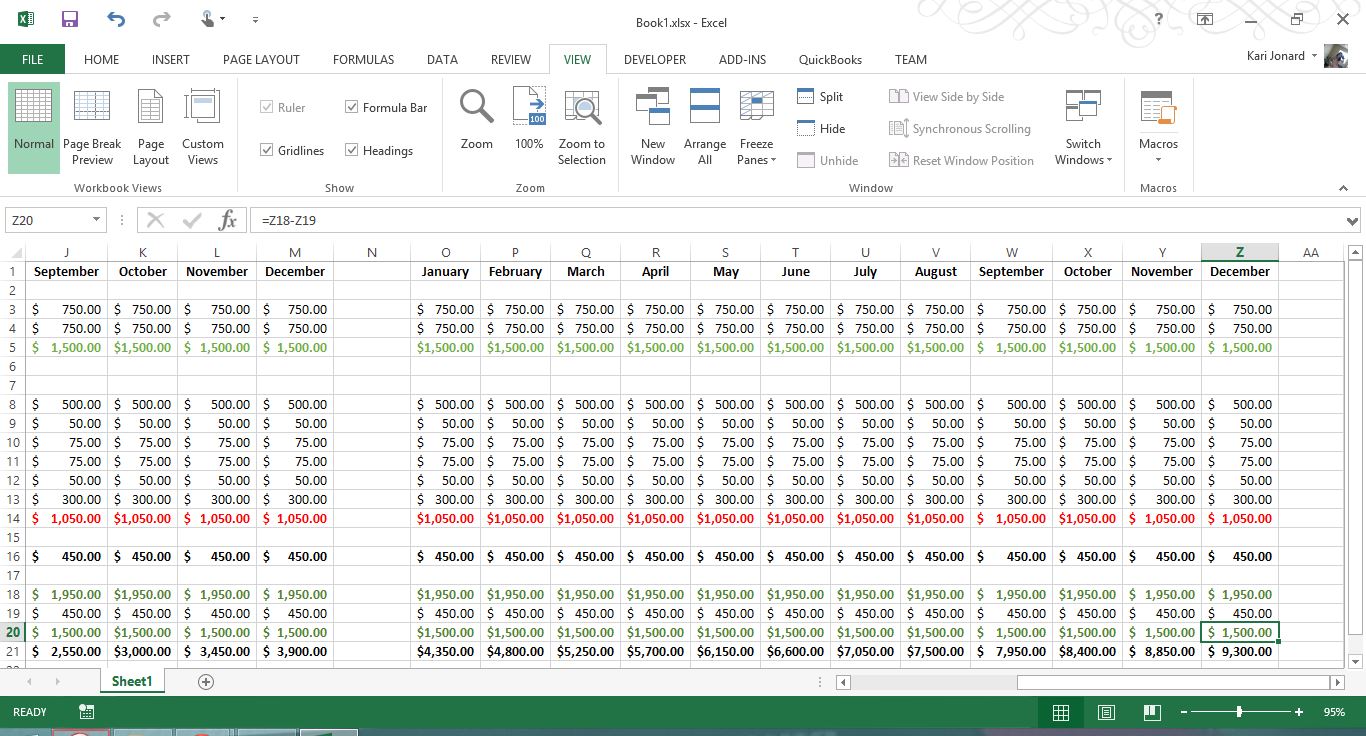
Next, add a column between December and January to separate the years. You can add the year in this column if you would like. Example: 2016.
Now that we have our projections extended for another year, we can see that the savings account will reach $6300 in June of year two.
If we were including the checking account, the savings account will reach $6300 in February. None the less, the more savings the better because you never know what will happen next.


This looks great! Thanks for the tutorial!
Cynthia @craftoflaughter